
EOS - The Dashboard
Shipped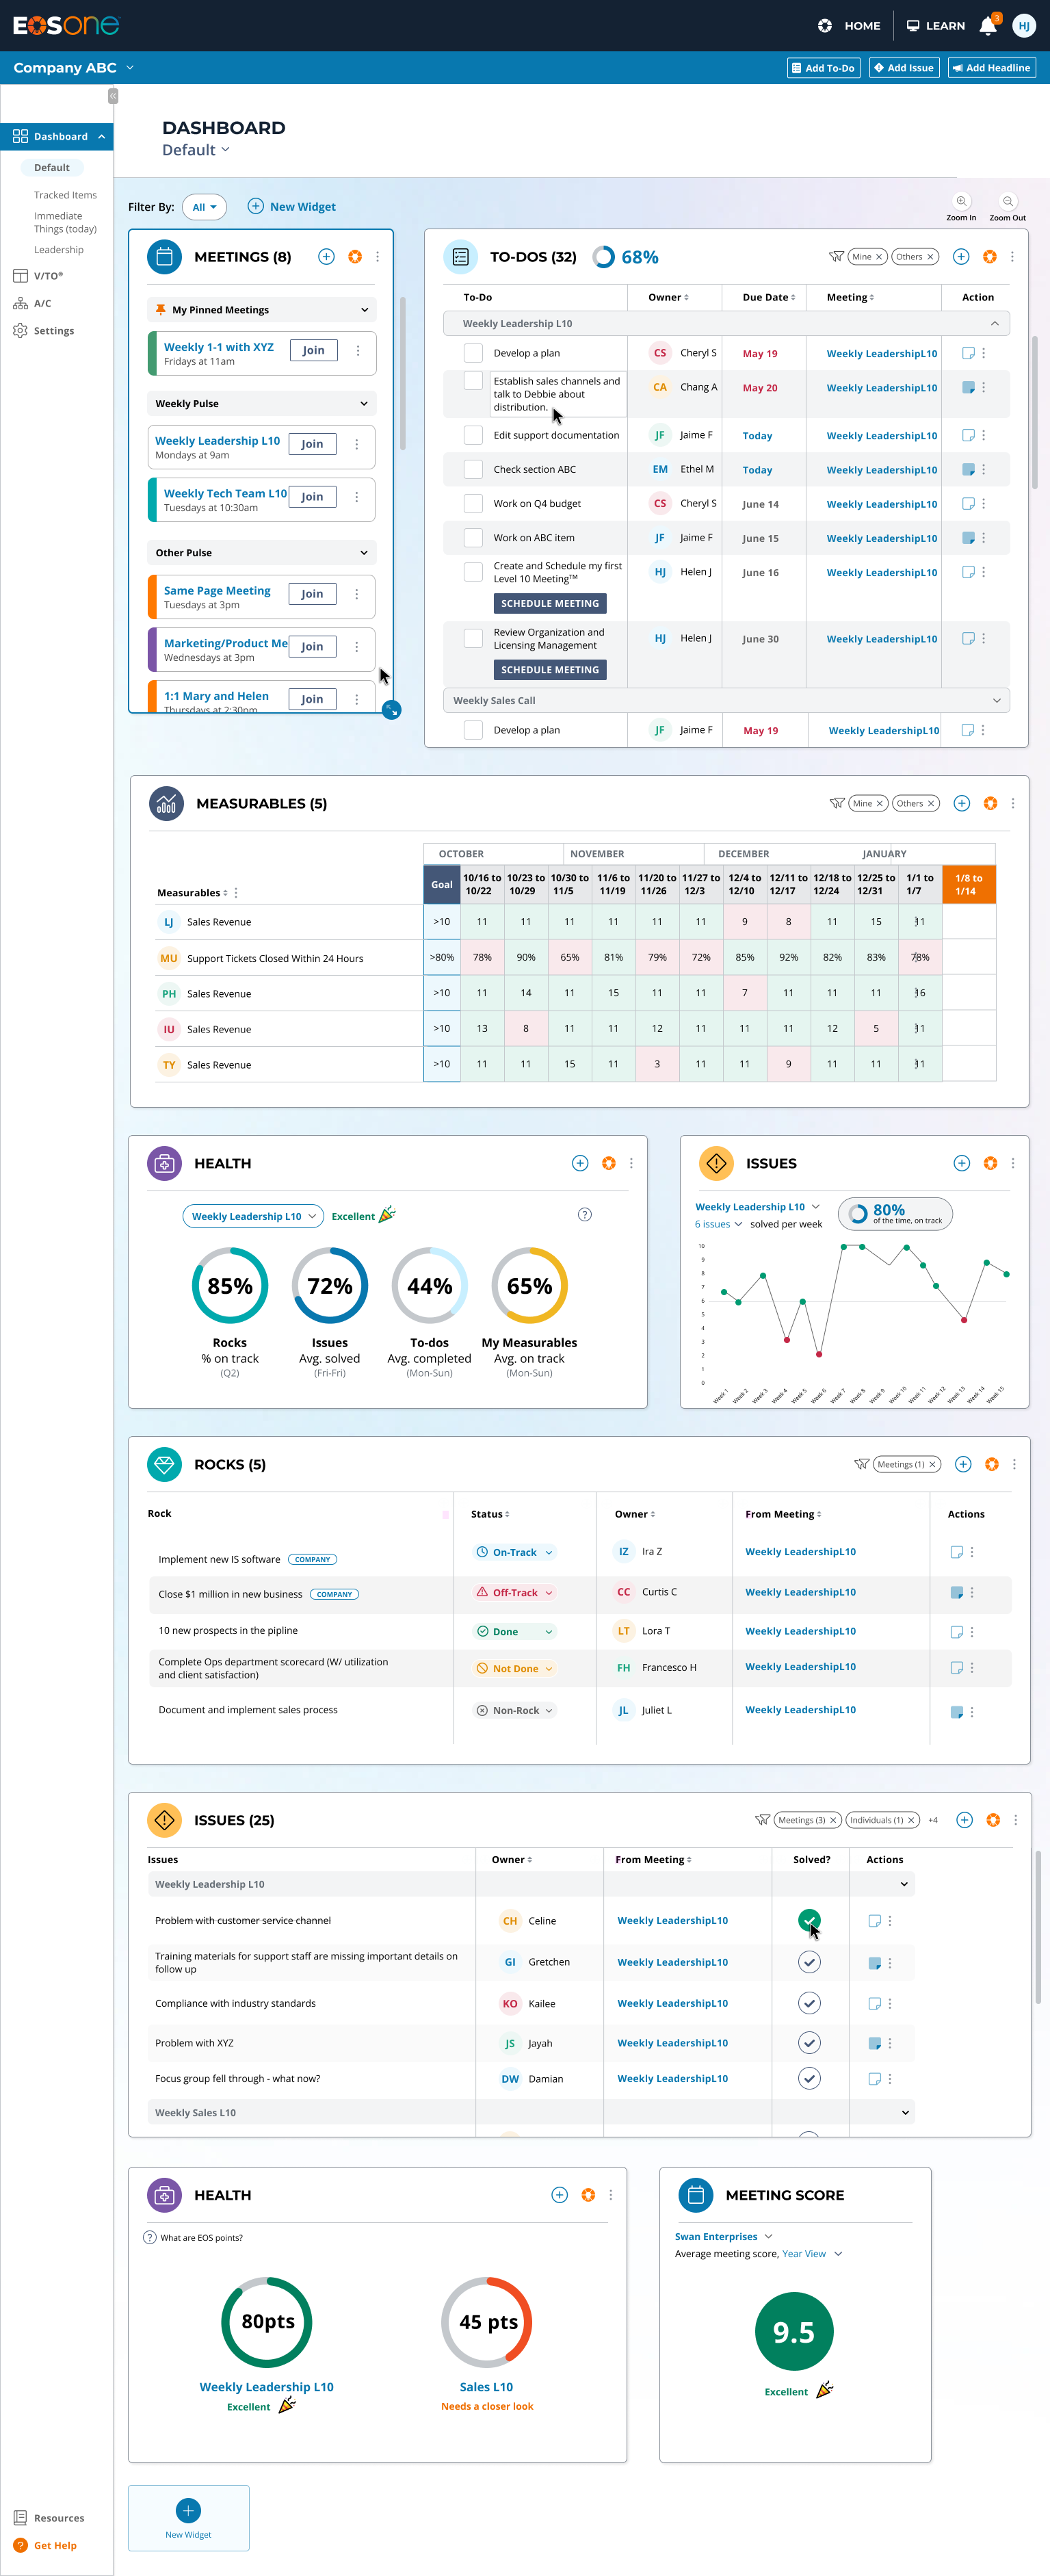
-
Problem
EOS One's MVP dashboard had been outgrown. Common actions took more steps than they should, and some users were cancelling over it.
-
What I did
Owned the redesign end to end, from user research to a customizable widget system built around speed, visibility and customization.
-
Result
Users spent more time on the dashboard and created more to-dos, on a platform that grew from a free beta to $1.5M ARR.
What is EOS?
The Entrepreneur Operating System (EOS) is a transformative framework designed to revolutionize how leadership teams and businesses manage their day-to-day and future goals. It provides a comprehensive set of tools and principles that streamline operations, foster accountability, achieves clarity in company vision and creates traction towards goals. The company has been running as mainly a paper-based company for 20 years - involving training, events, and multiple books. With this platform, EOS is expecting to grow substantially in the next few months. It is in direct competition with multiple other software products trying to do the same thing based on the EOS system books introduced in 2007.
Team Info / Structure
I joined this large agile team in October 2023 (as a contractor through Amy Hamm Design for Frogslayer) with 1 other product designer, 1 product manager and 1 product leader. I was later hired full time by EOS and our team grew to 4 designers and 3 product managers. Our development team was about 20 people and we worked across other departments as well to achieve the product vision. I was responsible for my own features and met regularly to refine them and receive feedback.
Achievements
- Designed a free beta SaaS platform that grew into a paid product.
$1.5M
From a free beta to paid ARR
11%
Conversion rate
6-9% above industry average 
63%
Conversion rate
38-48% above industry average
4,150
WAU on the platform
Other project responsibilities included:
- Designing this feature solely myself with feedback support from my team
- Attending agile meetings
- Presenting designs to stakeholders and developers
- User research, testing and interviews
- Writing tickets and defects in Azure
- Data synthesis and user pattern recognition in Excel and Pendo
 THE TASK AT HAND
A dashboard that had outgrown its MVP
EOS One's original dashboard had been built quickly to support an early product launch. It did its job as an MVP, but as the platform matured, users wanted way more "power" from it - some were even cancelling their subscriptions because of the lacking dashboard experience.
Through ongoing research, we found that common actions like adding a to-do, updating a metric, or checking on another team's work often required more steps than the task itself warranted. The dashboard showed basic information, but it wasn't yet functioning as the command center our users needed.
I started to rethink that experience around three ideas: speed, visibility, and customization.
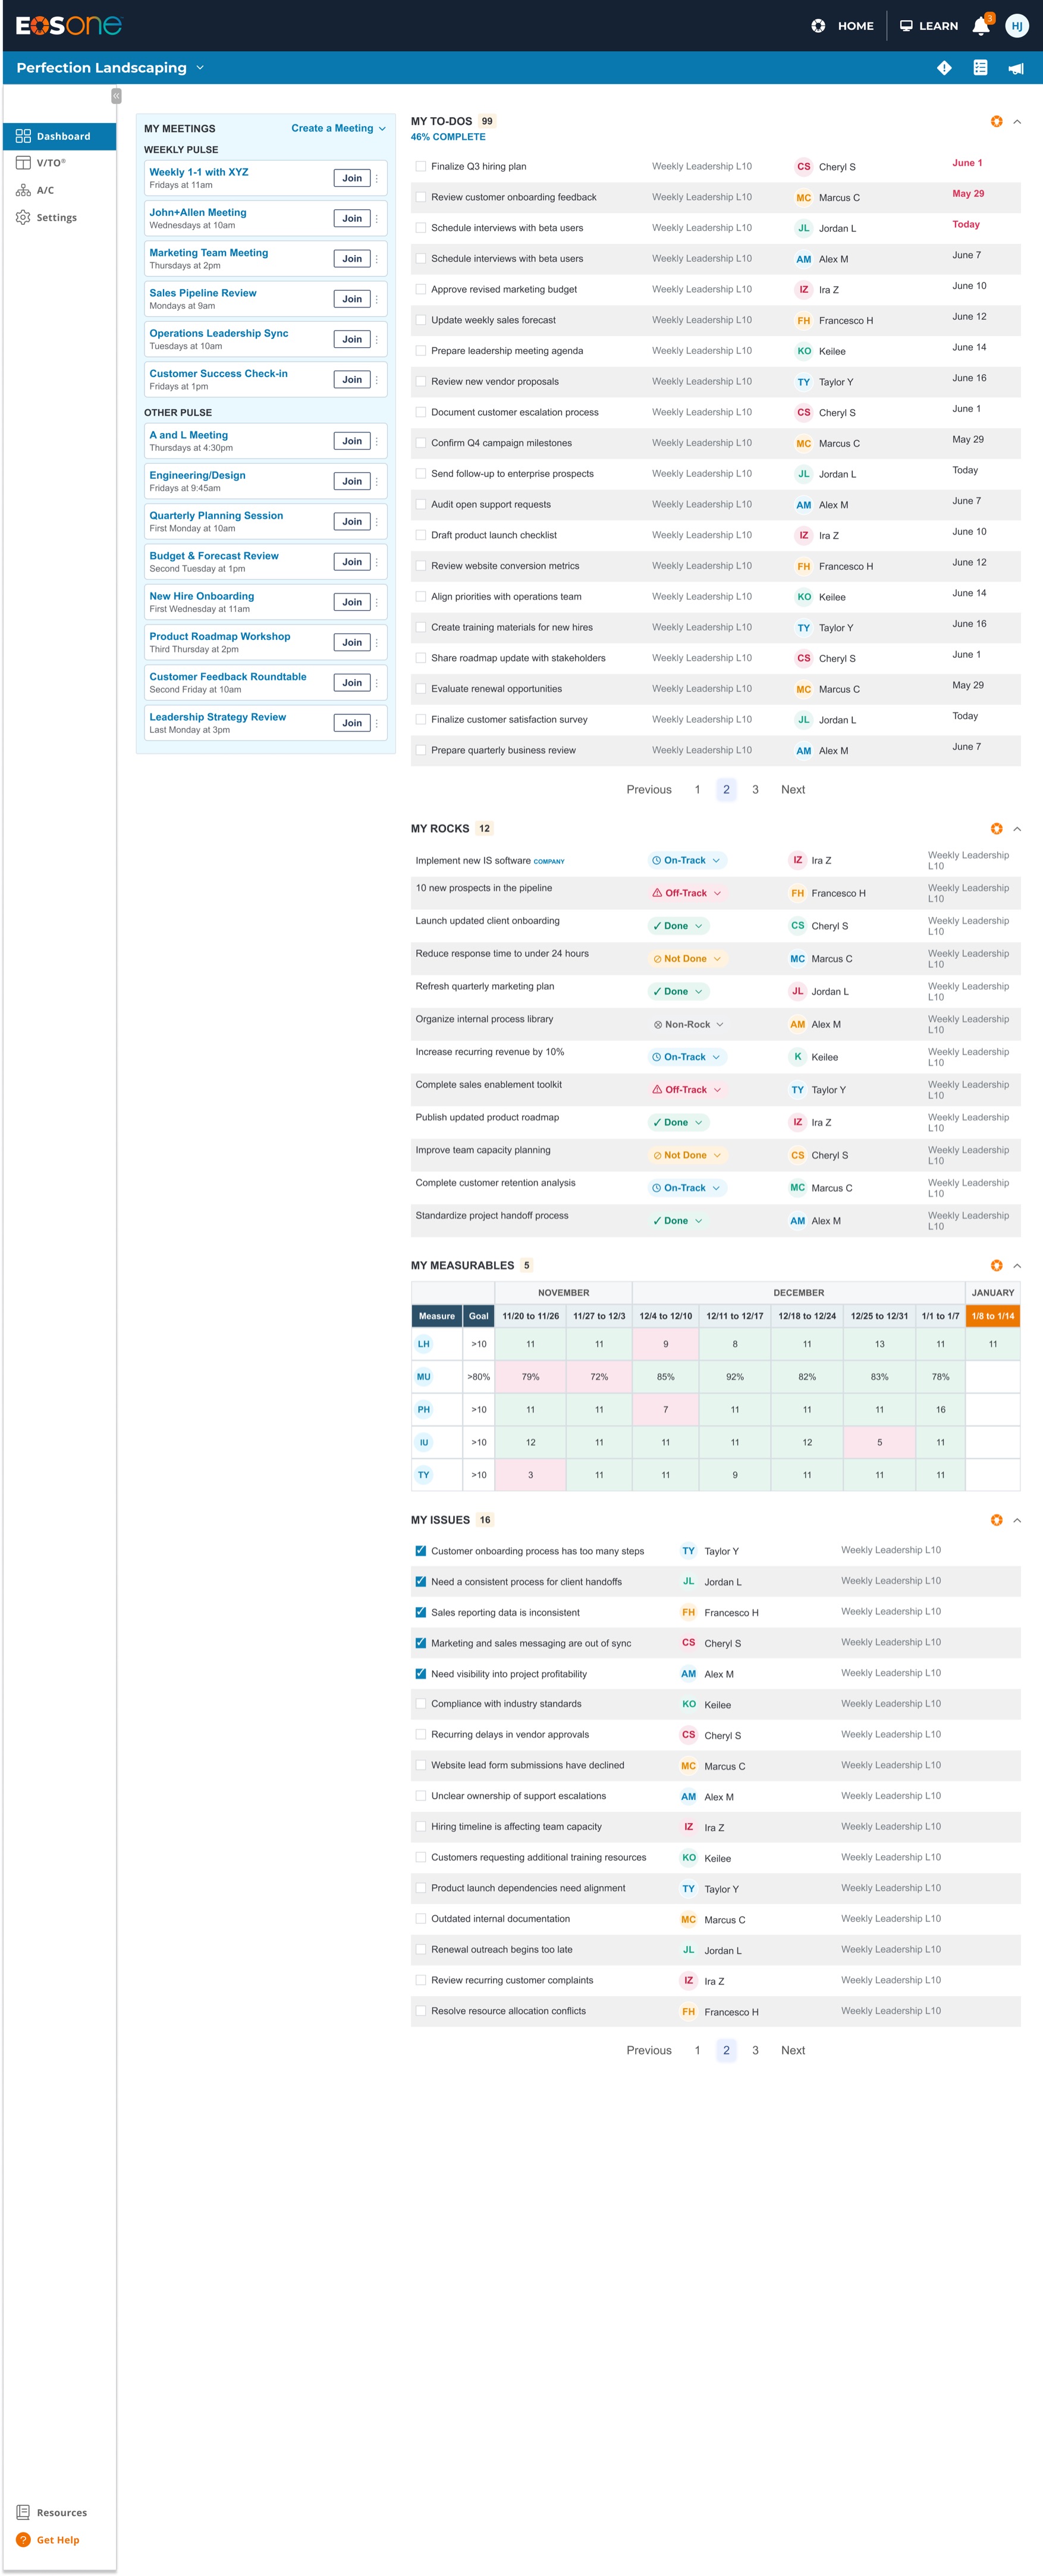
(health, issues analytics and meeting score not in scope)
 RESEARCH & DISCOVERY
Different roles need different views
Our users - many of them business owners and leadership teams - manage a lot at once: meetings, quarterly priorities ("Rocks"), to-dos, issues, and company metrics. The existing dashboard surfaced some of this, but it wasn't particularly fast to act from. Users frequently had to leave the dashboard, navigate elsewhere, open a modal, make a change, and return.
There was another problem: the information most important to one person wasn't necessarily the most important to another. A business owner might want a high-level view of company health. A team leader might care about their team's priorities. An Integrator might need to keep a close eye on a struggling team's metrics specifically.
I combined several research inputs:
- 110 user interviews with business owners and other key users
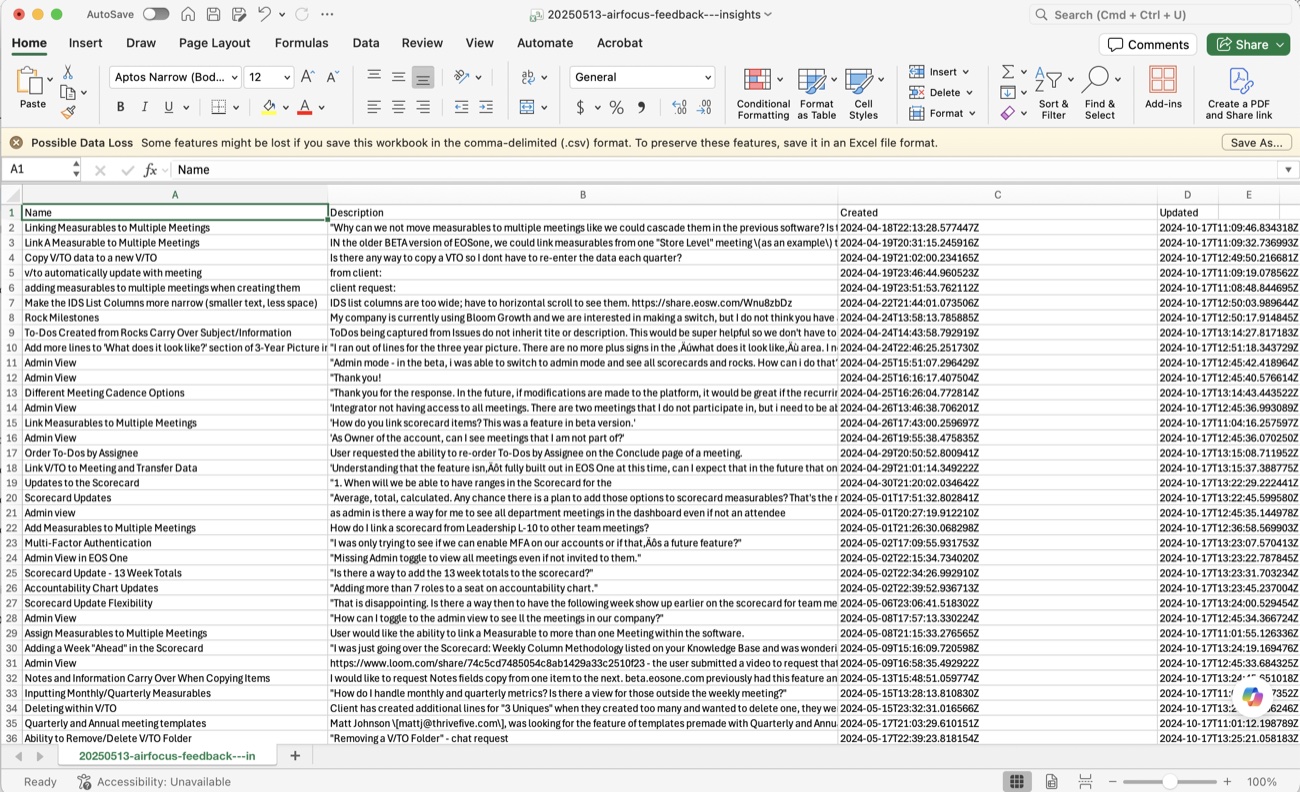
- 2Feedback submitted through our in-product feedback system
- 3Pendo session replays showing how people actually navigated the dashboard
- 4Product analytics and behavioral patterns
- 5Internal dogfooding (we ran our own work inside EOS One every day)
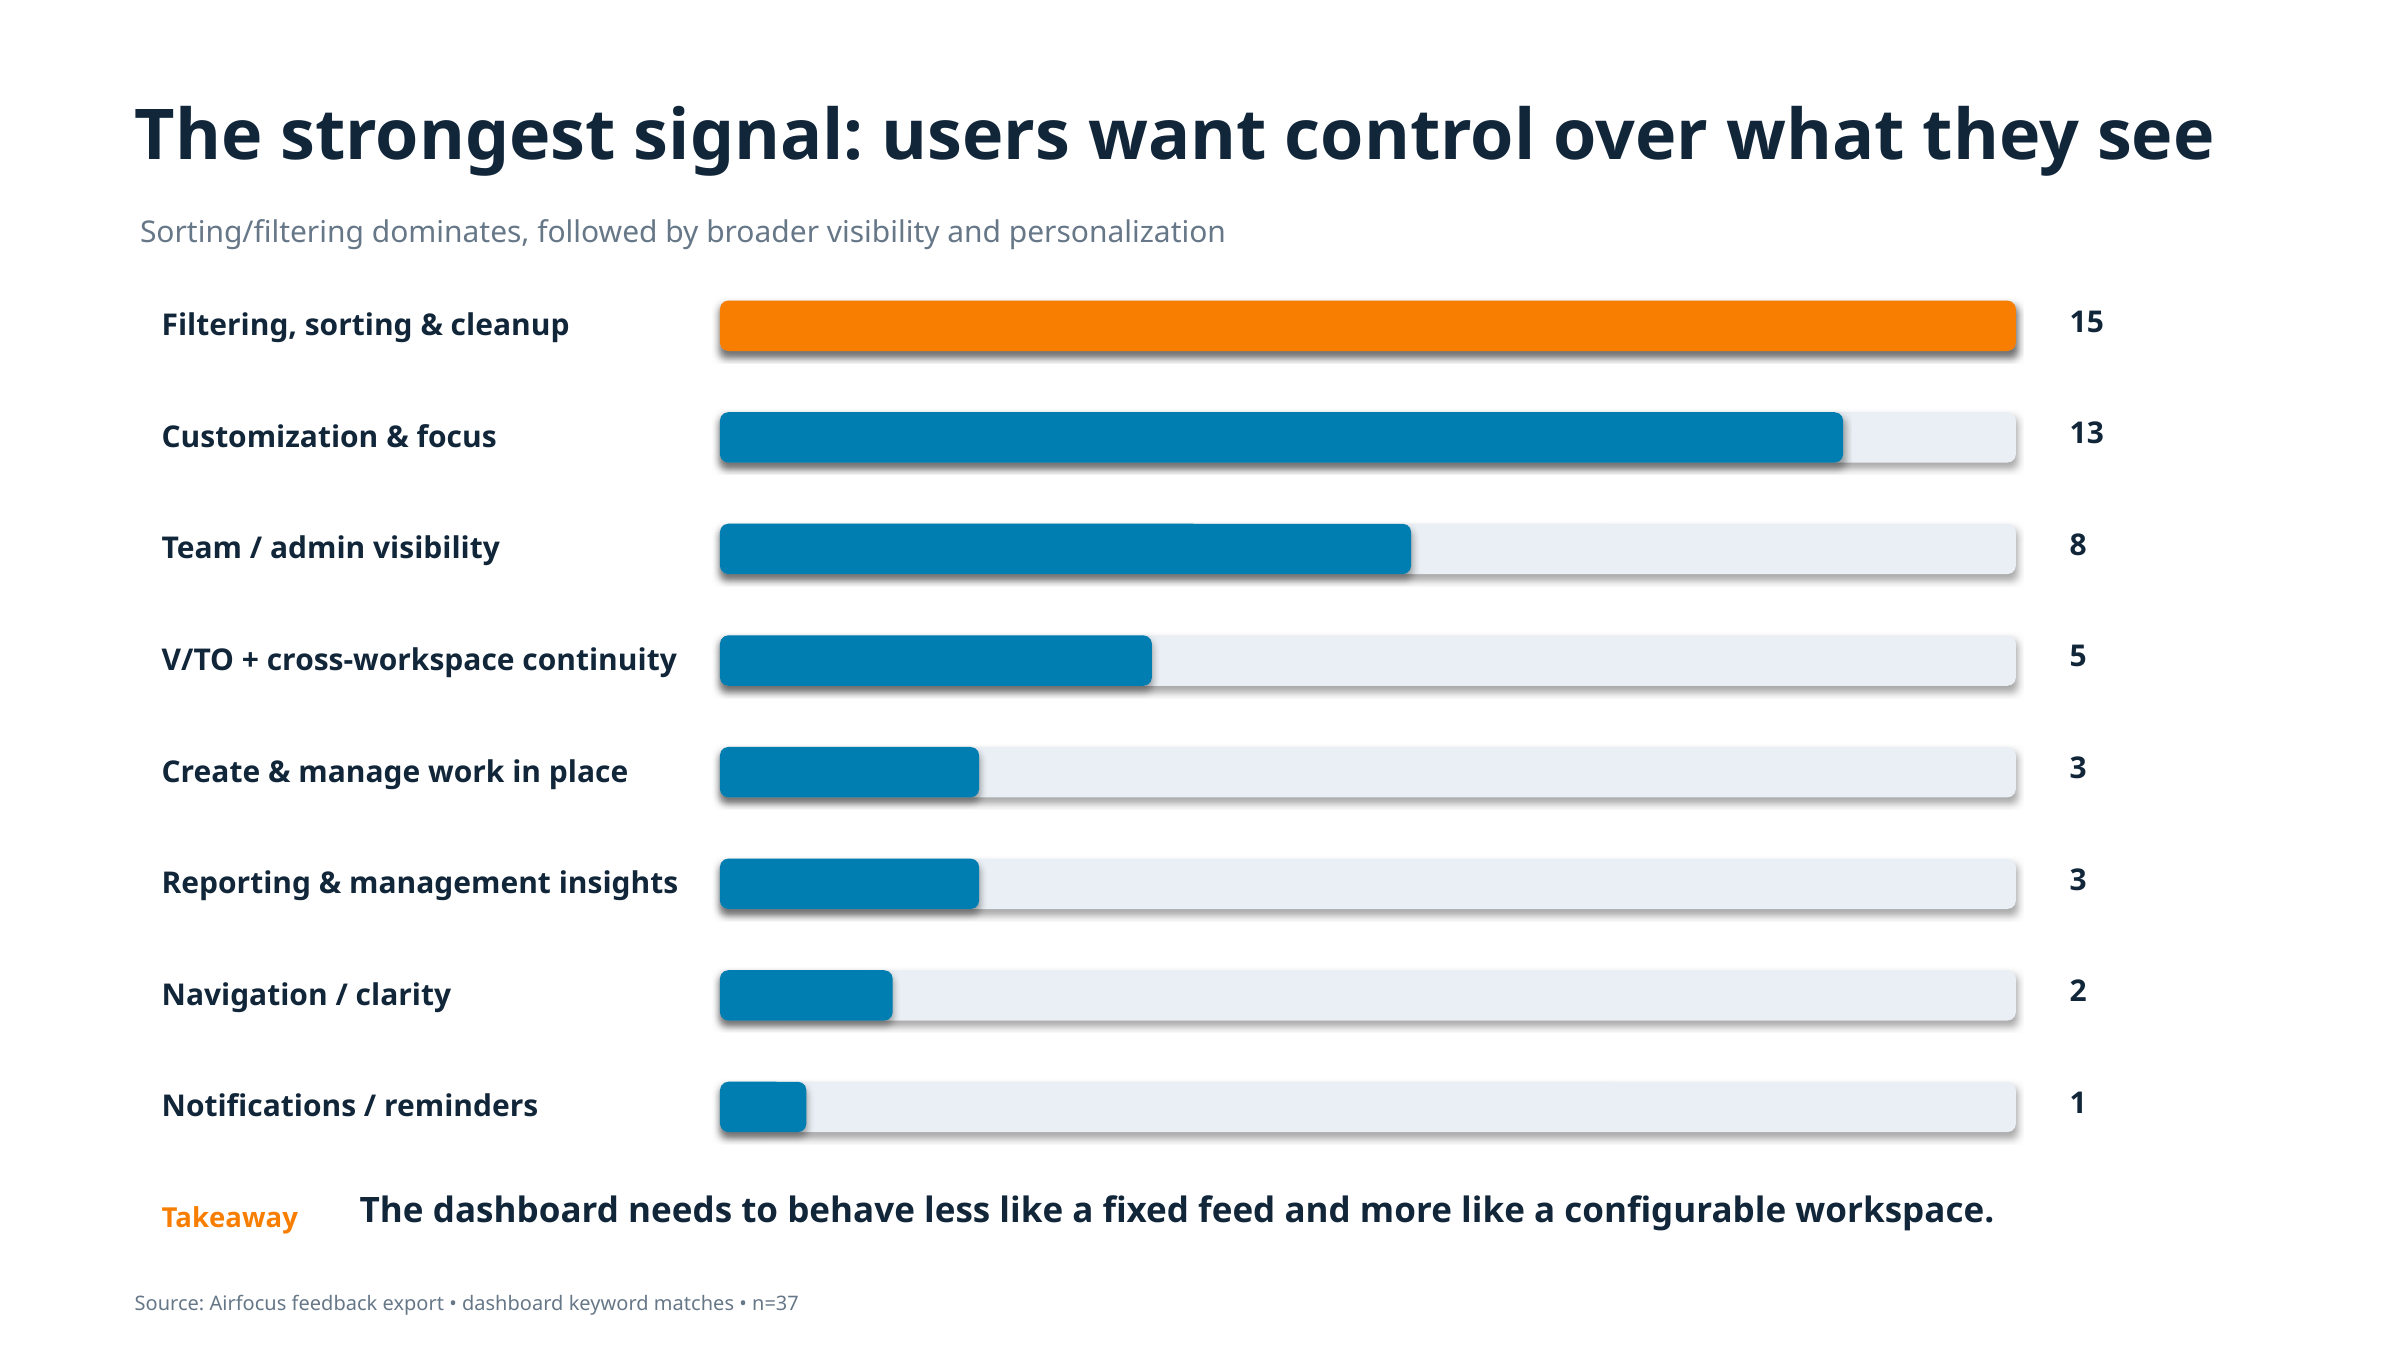
Watching sessions in Pendo was particularly valuable - we could see users arrive at the dashboard and hesitate, navigate elsewhere to complete simple actions, or repeatedly open and close modals. The pattern was consistent: users were not finding value from the current dashboard and were struggling with how many steps it took to add or see an important item.
One user interview particularly stuck out to me. An Integrator explained that she wanted to monitor metrics for a team that had been struggling - not her own team's metrics. She needed visibility into whatever part of the organization needed her attention, no matter where that was. That conversation reinforced something we were seeing elsewhere: organizational roles didn't map neatly to a single predefined dashboard. Users needed control over what they saw, whose work they saw, and how that information was organized.
"If an add button was on the dashboard, THAT WOULD BE AMAZING!!!!!
-User feedback
"Managing 400 users and 200+ meetings without an admin dashboard made oversight difficult.
-User feedback, cancellation
"As an admin, is there a way for me to see all department meetings in the dashboard even if I'm not an attendee in their meeting cadence?
-User feedback
 IDEATION & PROCESS
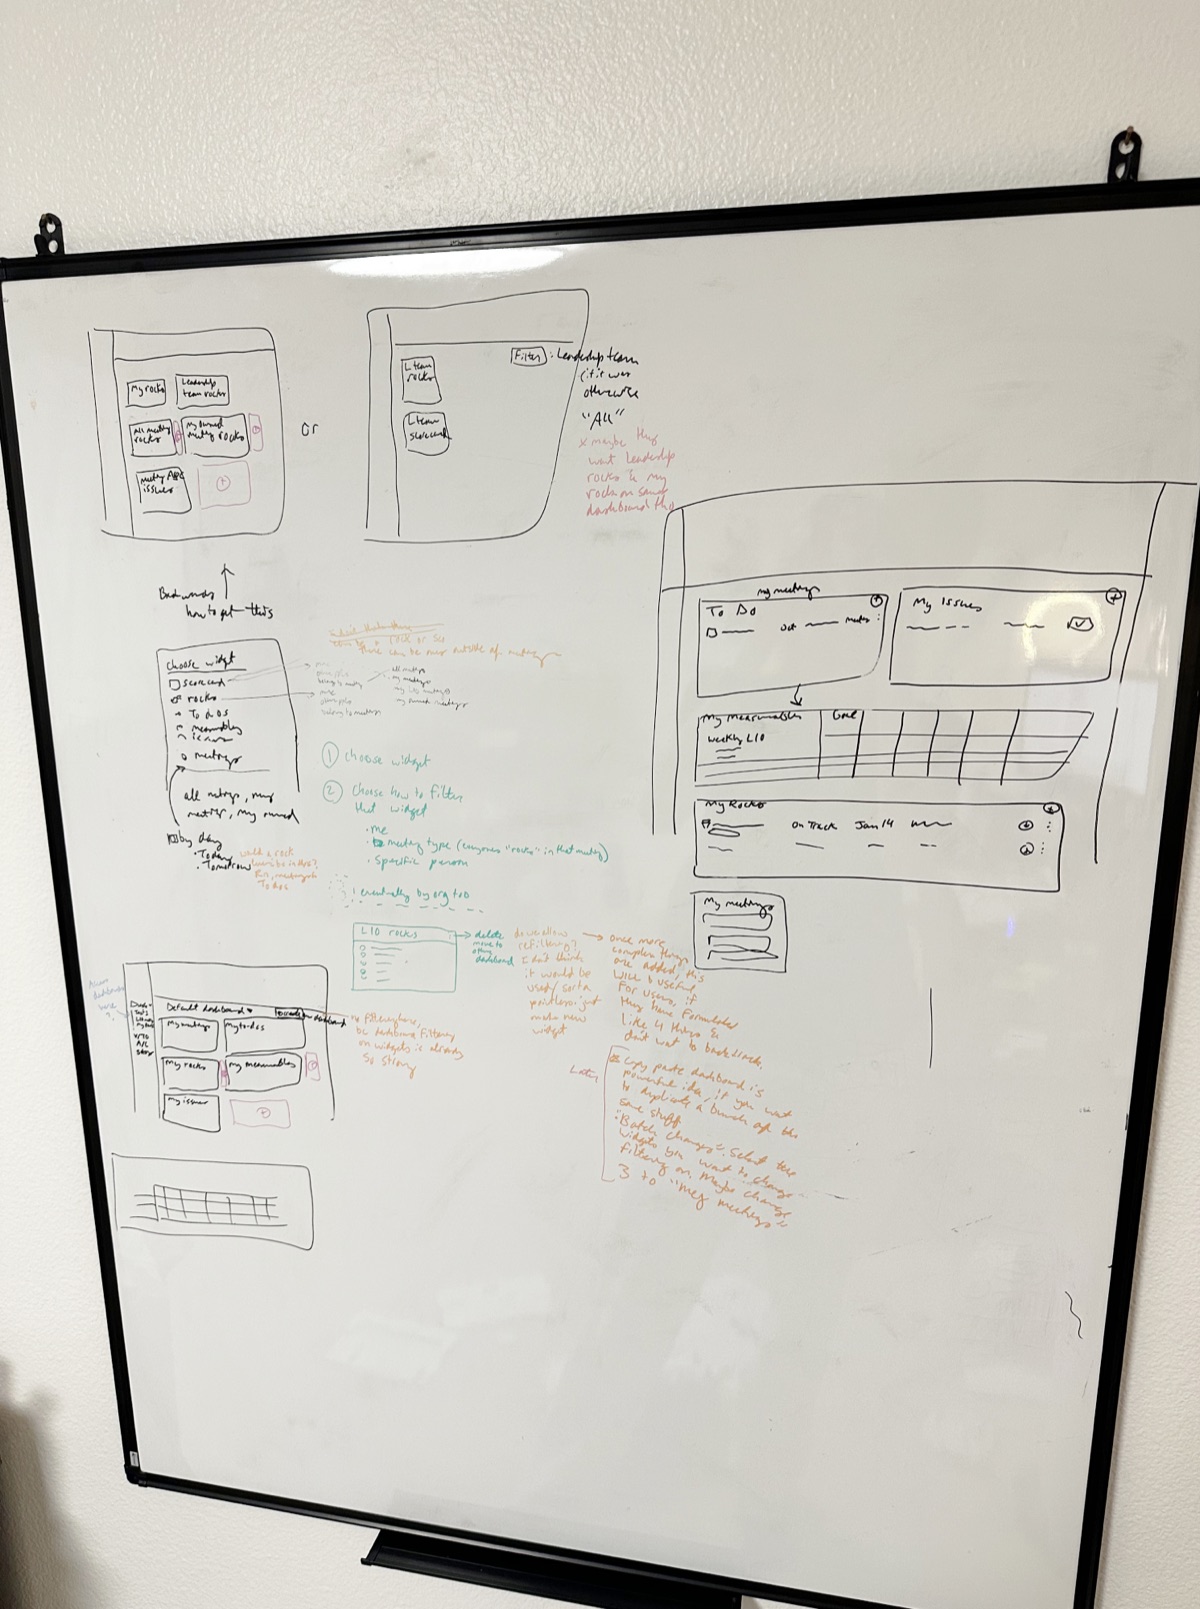
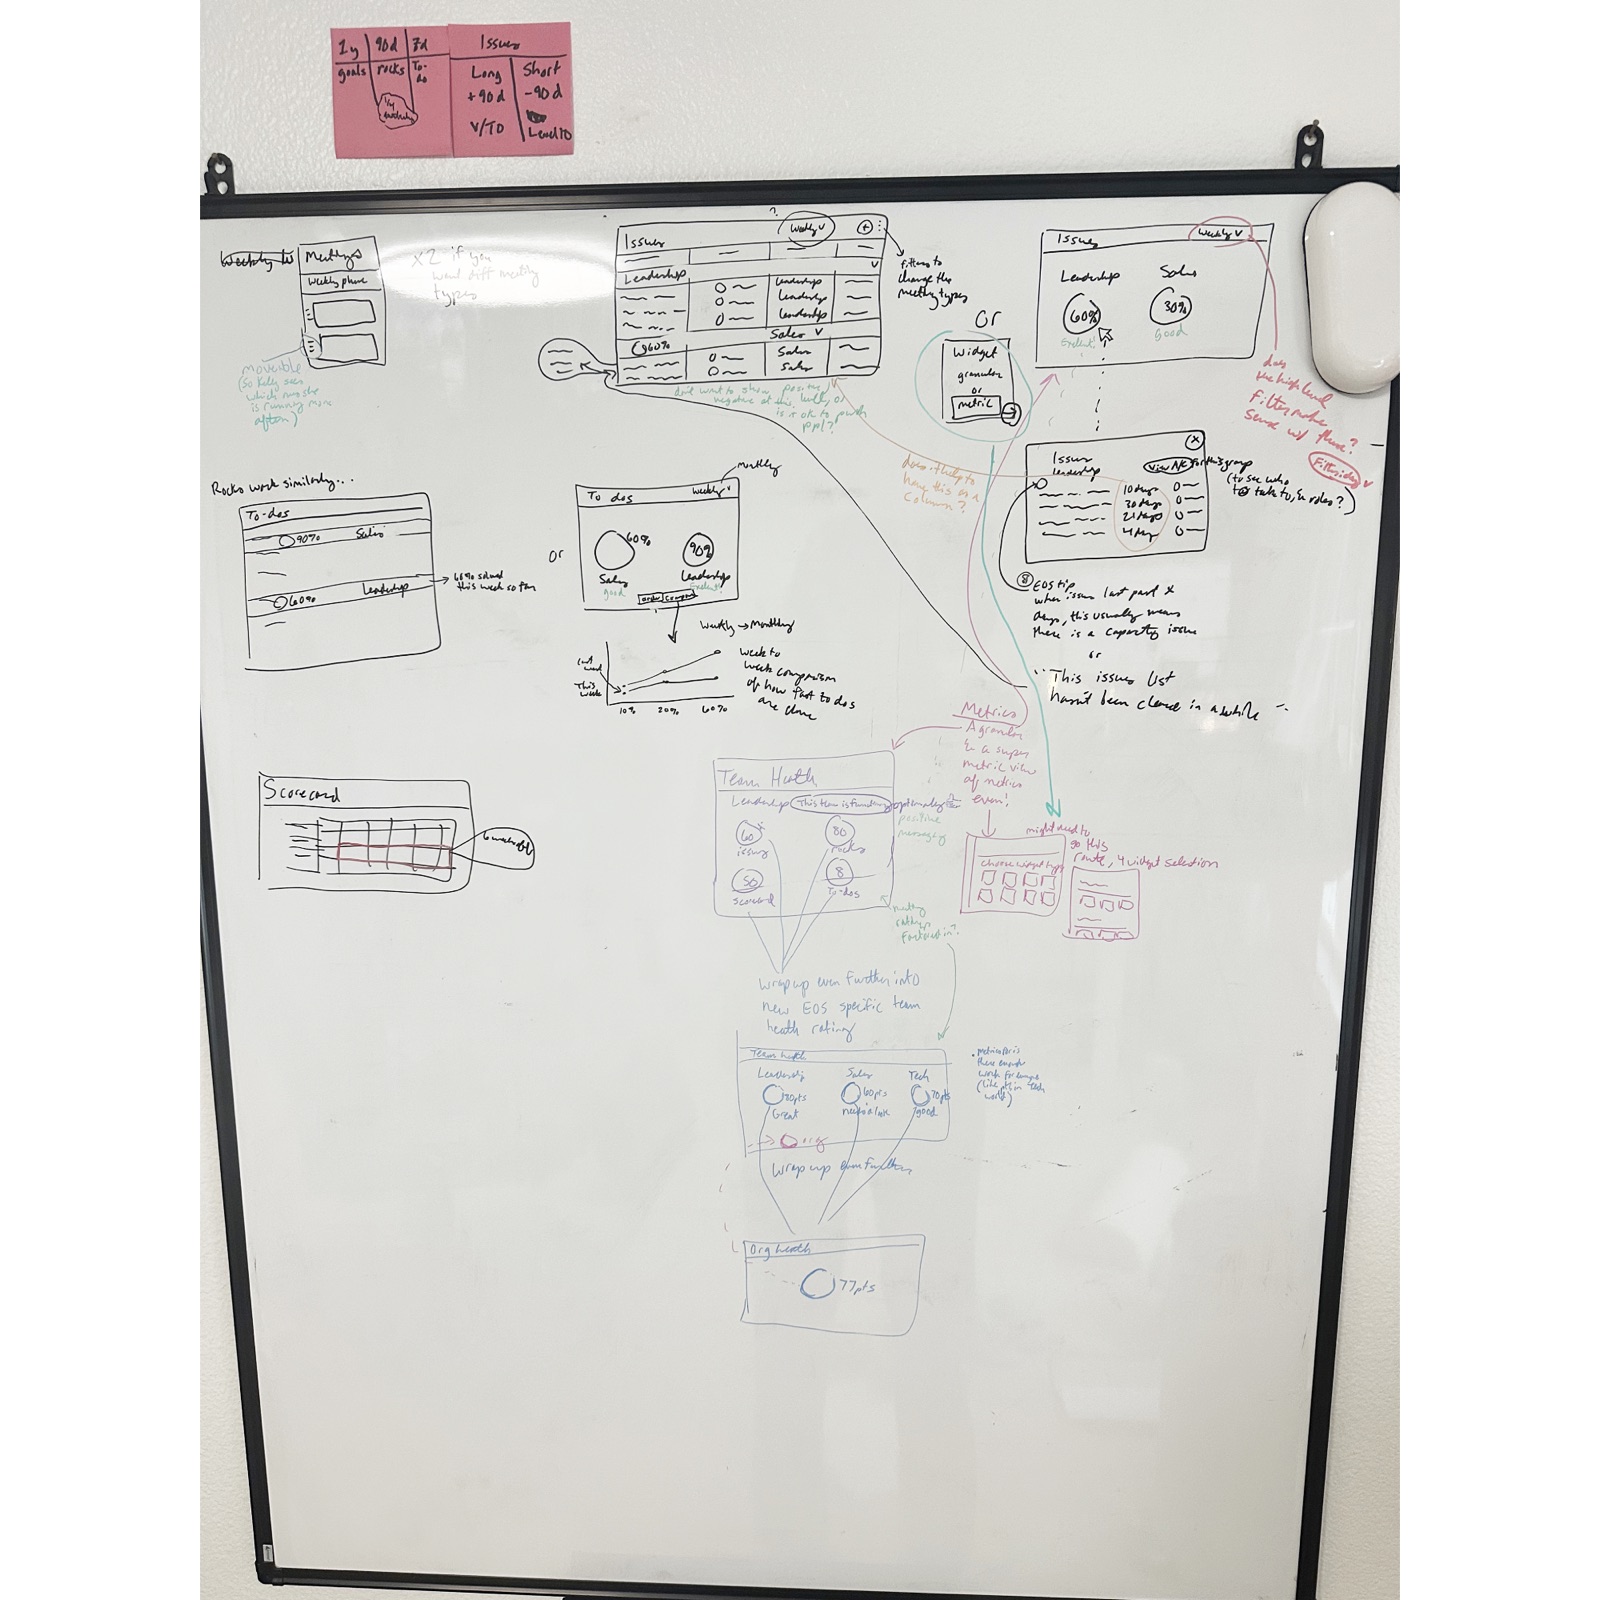
I heavily use sketching/whiteboarding during early exploration (a trademark of my architecture days) I need to know what we're assuming, and what still needs to be answered. My boards get messy, in a useful way. I connect related ideas, map workflows, write questions as they emerge, and use a color system to distinguish research findings, assumptions, technical questions, and ideas needing further validation.
For this project, that process helped iterate quickly on different ideas, information and actions that users would find invaluable within a dashboard.
 THE SOLUTION
A flexible system of information and actions
1
Make the Dashboard Actionable
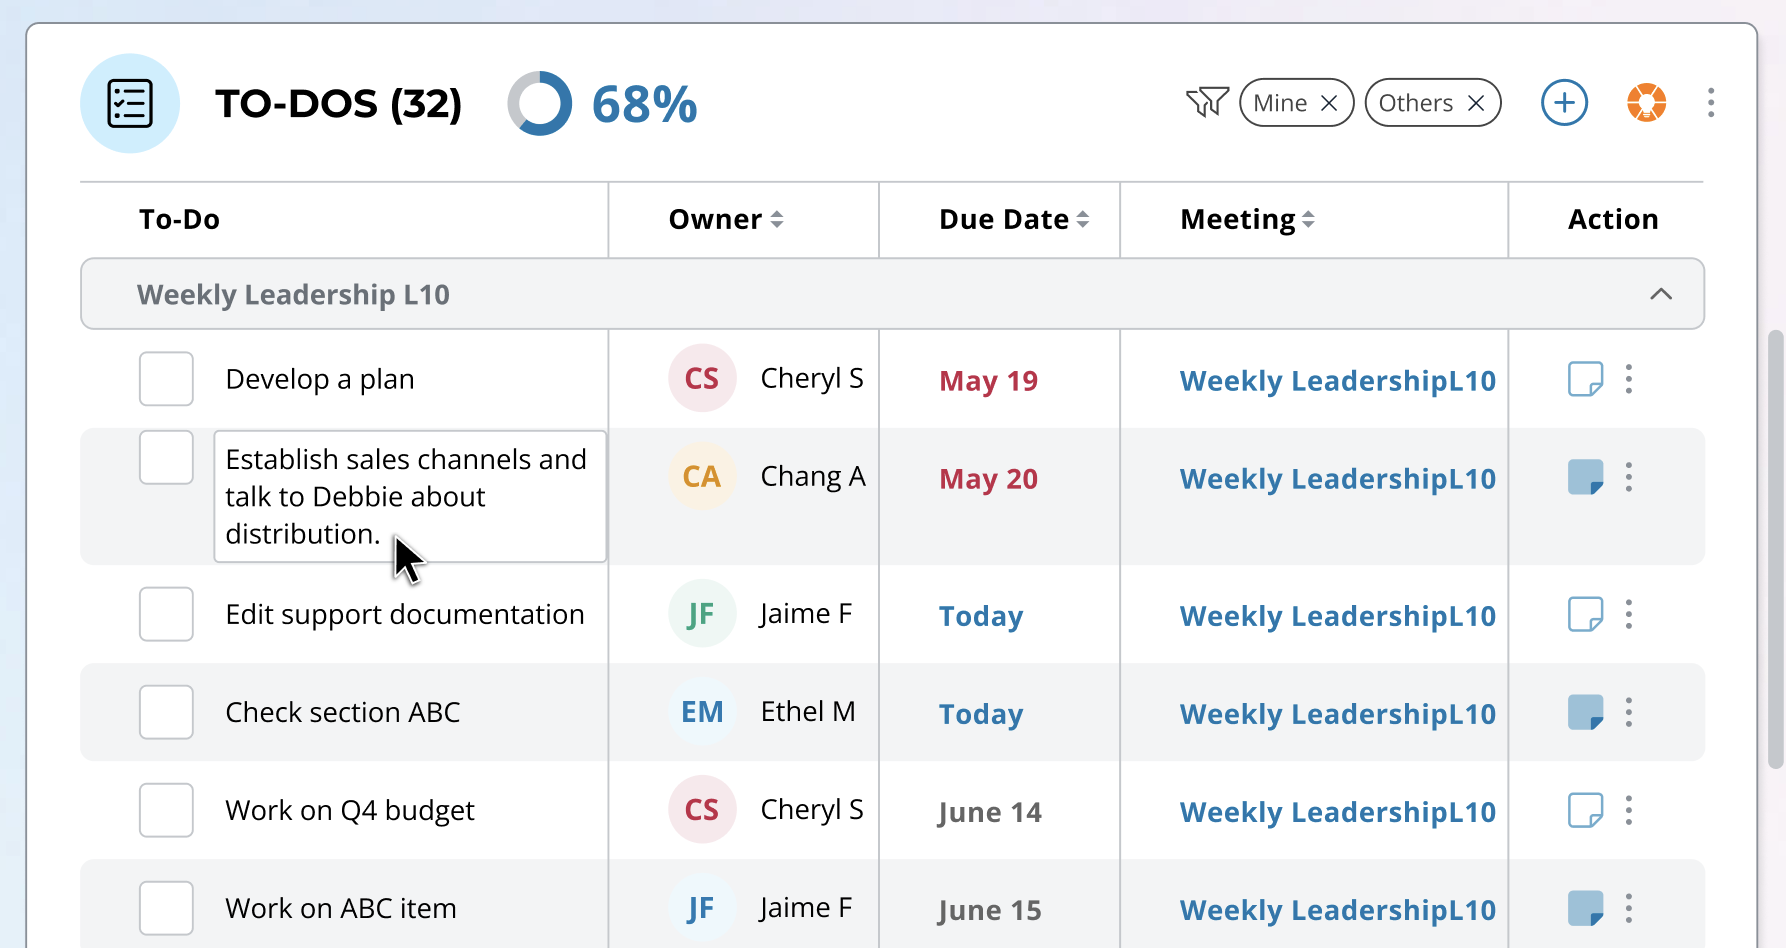
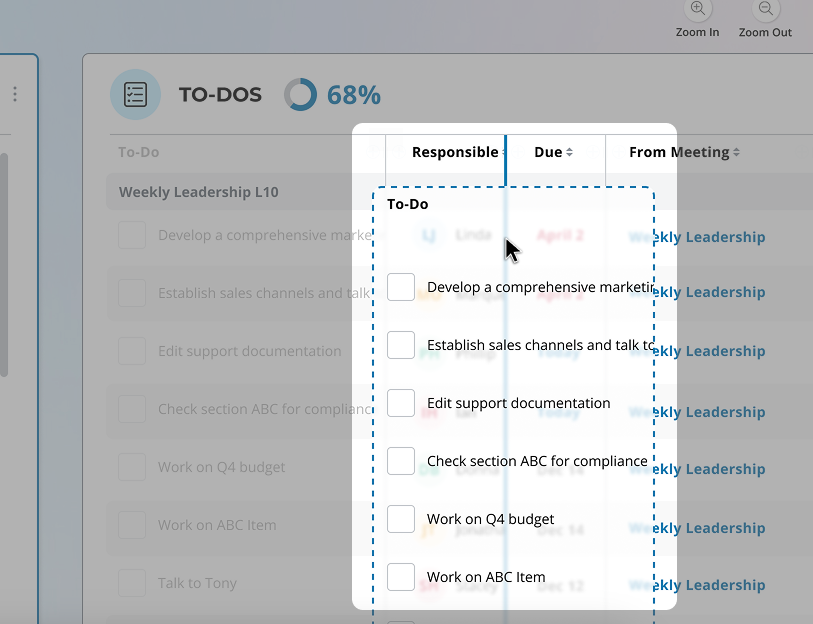
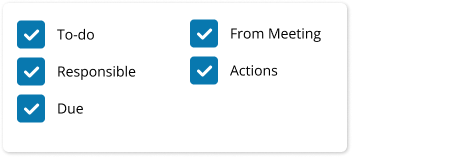
One of the biggest opportunities was reducing the distance between seeing something and doing something about it. Instead of requiring users to navigate deeper into the application, I designed common actions directly into the dashboard. Users could quickly:
- Add a to-do, create an issue, or update a metric
- Join or schedule a meeting
- Edit information inline
- Click a meeting inline on a widget to jump straight to its meeting home page
Where an action previously required several clicks and a modal, the goal was to make frequent interactions feel closer to one click and done.
2
Let Users Decide What Deserves Their Attention
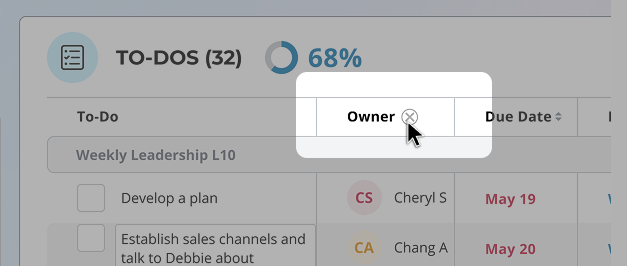
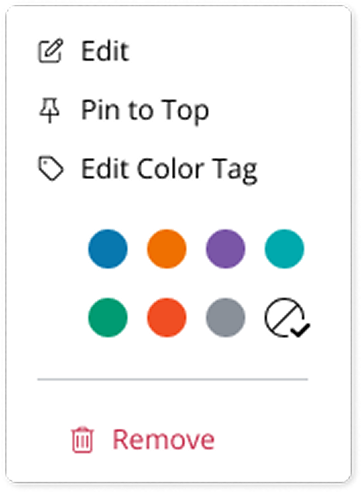
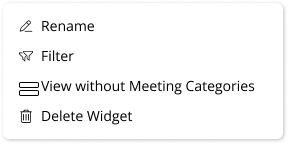
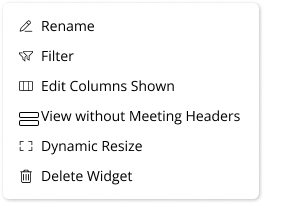
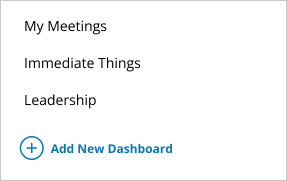
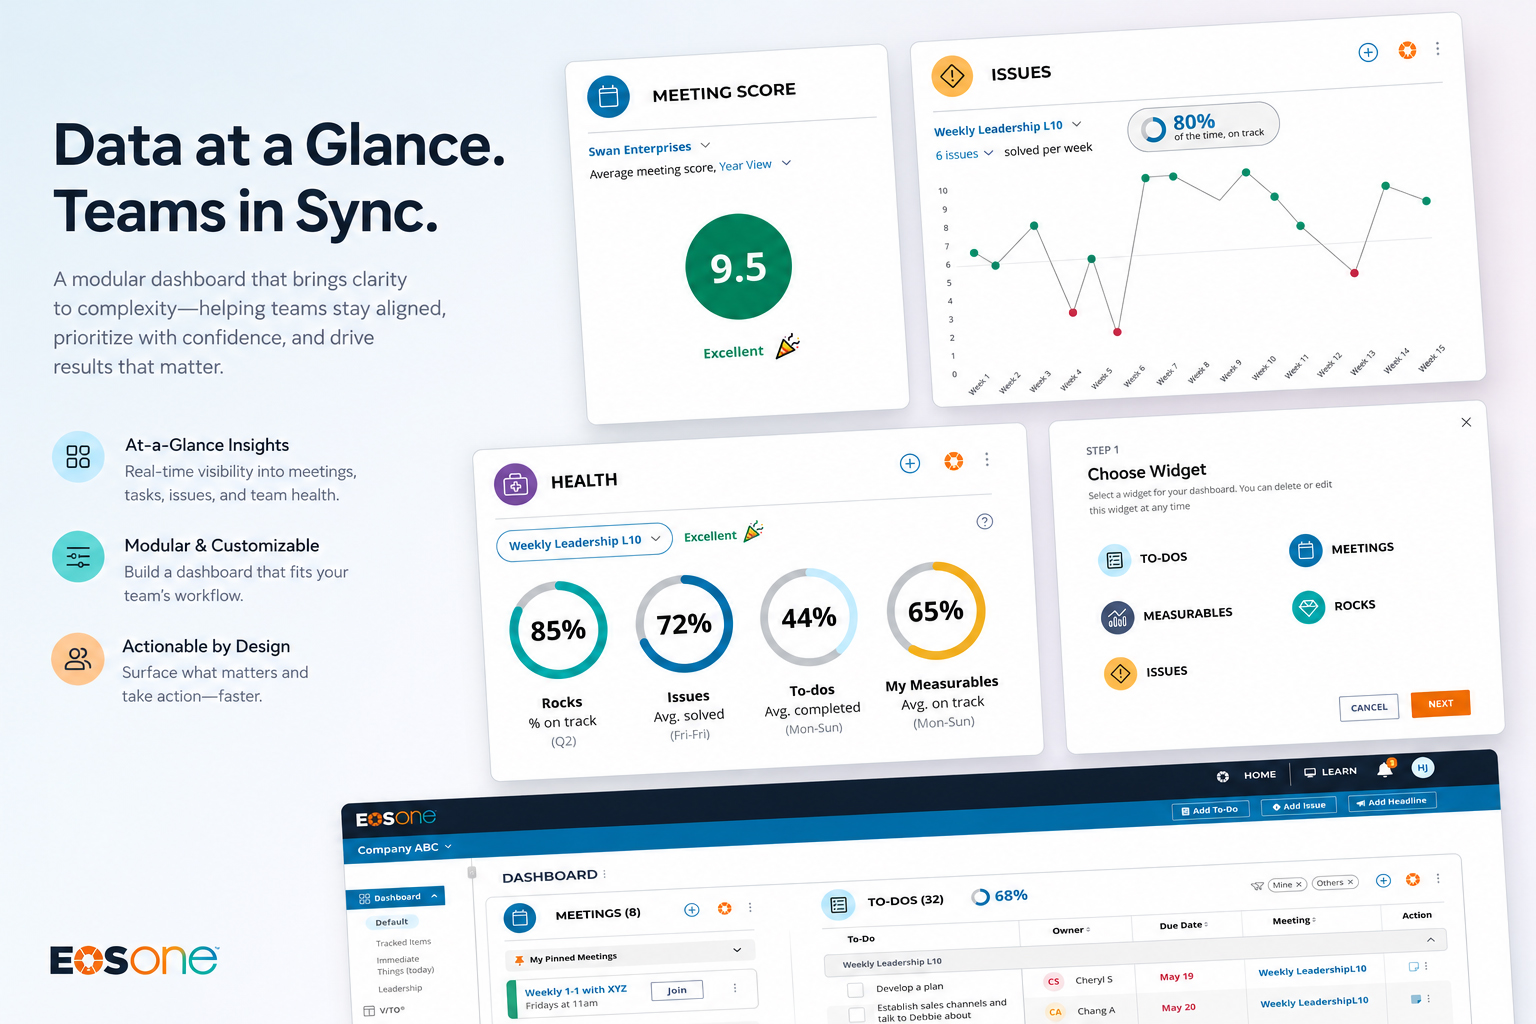
Rather than one universal dashboard, I designed a modular widget system that adapts to different roles and workflows. Each widget could be filtered to surface a specific slice of the organization. A leader could create one to-do widget for their own work and another showing a team's outstanding tasks. Users could even add multiple instances of the same widget with different filters applied.
I wanted the dashboard to feel less like a static reporting page and more like a workspace users could shape around their responsibilities.
The concept allowed users to:
- Drag and rearrange widgets
- Resize widgets based on importance
- Create multiple versions of the same widget
- Filter widgets by team, owner, or other relevant criteria
- Create multiple dashboards for different contexts
That meant a business owner could maintain a company-level dashboard while also having a separate view focused on a specific team or area requiring attention.
3
Turn Data Into Signals
I also explored how the dashboard could move beyond displaying lists and begin helping leaders understand how their organization was performing at a glance. Concepts included a company health view combining signals across Rocks, Issues, To-dos, and Measurables, along with deeper visualizations showing trends like how consistently teams were solving issues. The idea was to make the dashboard useful at two levels: “What's happening?” and “Where should I pay attention?”
 OUTCOME AND LEARNINGS
Shipping the first step toward a bigger vision
I always love working closely with engineering, and in this case it helped me understand where complexity was hiding. Interestingly, the widget architecture was more achievable than some interactions that appeared simpler - inline editing, for example, introduced considerably more development complexity than anticipated.
We prioritized the parts of the experience that could deliver the most immediate value within our timeline. The shipped dashboard represented the first step toward the broader vision, while more advanced concepts such as deeper company insights, multiple tabbed dashboard views and richer Issues analytics, remained future opportunities.
 OUTCOME & INSIGHTS
Users started spending more time on the dashboard
After launch, Pendo showed users spending more time on the dashboard. In this case, increased time was a positive signal: the dashboard had become a place where users could actually accomplish work, rather than simply pass through on their way somewhere else.

We also saw increased to-do creation after making the workflow easier and more accessible directly from the dashboard.
